
The purpose of this blog entry is to shed some light on the possibility of using the standard deviation as a measure of risk on different themes, types of sets and so on when investing in LEGO. This article will assume that LEGO returns follow a normal distribution.
I am sure several of you already know about standard deviation, since it is often used as a measure of risk in more traditional investments like stocks, mutual funds, etc. For those of you that don't know much about it, we use standard deviation to determine the volatility of a particular investment or portfolio by evaluating how much is the data spread from the mean investment return. As a quick example, let's evaluate this simplified scenario: (The numbers below are not actual figures and are used for illustrative purposes only)
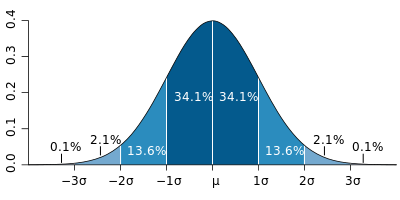
Also, it is good to have the normal distribution graph as well to make it the following analysis easier to understand:
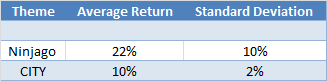
So, what the numbers in the table above tell us can be summarized as follows: If the average return of the sets that constitute the Ninjago theme is 22%, a standard deviation of 10% indicates that, per the normal distribution, for a particular set among the theme the probability for its return to be between 12% and 32% is around 68%. Another read that could be made is that there is a 95% chance that a particular set returns between 2% and 42%.
Further examining the example we can take a look at the CITY figures. In this case, there is a 68% probability that a CITY set will return between 8% and 12%, a substantially smaller range than that of Ninjago sets. What this basically means is that you are more certain about what kind of return you will be getting when the standard deviation measure is lower than when it is higher.
Now that we got that out of the way, let's examine how we can use the measure to our advantage in LEGO investing. I will just give you an example using two different type of sets and what we can gather from the numbers they present, so that later you can probably do the same with themes or sets that interest you more. I will only be using returns of already retired sets, since that is the kind of information that is the most valuable. Also, I selected only four sets of each theme for simplicity purposes, but the more you include the more accurate the result.
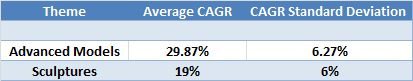
What the figures above mean is that you can expect a CAGR between 13% and 25% about 68% of the time when it comes to LEGO Sculpture sets, while the range for Advanced Models is a little wider (23.6% - 36.14%). By analyzing these results you will be able to determine that even though both investments have pretty much an identical standard deviation measure (risk), the Advanced Models theme will generate, in general, better performances that the Sculpture sets, so in theory you would be better off investing in the former rather than the latter. Same risk but higher return.
One last thing before we continue, the 68% confidence interval is not the only one you can analyze when performing risk analysis, especially if you are someone with a low risk tolerance, since there is still a 32% chance that the returns will fall outside of the range explained above. A better measure for those that are more risk averse would be to consider the 95% confidence interval, that would give you a range of returns from 7% to 31% with only a 5% probality of it going outside the range (in the case of Sculptures, for example)
There are several variables at play that we need to consider when doing this type of analysis, so I want to say that this short article is just intended to give you an overview of what is possible to accomplish by using this measure. Standard deviation can be used also to determine the spread of other investment figures like change over retail and some of the others, as well as used both for complete theme vs. theme analysis or some more specific comparisons.
If you are interested in checking out some different sets or themes, I attached a small Excel spreadsheet that shows the way I calculated the numbers in the table above.
-
 Excel.xlsx (10.16KB) : 18


Recommended Comments
There are no comments to display.
Join the conversation
You can post now and register later. If you have an account, sign in now to post with your account.
Note: Your post will require moderator approval before it will be visible.