
In the world of finance, investors are usually interesting in measuring the performance of their portfolios against a benchmark or to at least compare them to some of the other investments they had available at some point. Doing this analysis is extremely important, as it is the only way to determine how your personal investments have done relative to some others in the market. For example, say your portfolio produced a return of 20%, I am sure most of you would be happy with that number and would ask no more questions, but just think of how different things would be if you knew that the return of the overall market as measured by the S&P 500 was 30% (I am using exaggerations to make the point more visible) your portfolio would then have underperformed the market and instead of happy you probably would be kicking yourself!
Relative performance is a very important aspect to keep in mind when investing, as you see from the example above. Now, there is one other thing that we should take into account that takes what I explained above one step further. Let's now assume your portfolio returned 32%, while the market had a return of that same 30%, in this case you can accurately say that your investments outperformed that of the overall market. Having said that, let's also assume that the standard deviation of your portfolio was 50%, while the market's was only 25%. What really happened in the end is that you took double the risk to capture just a 2% of extra return, and to me that is a mediocre extra return for such a high extra risk.
How can we then adjust for risk and make our performance evaluations more accurate? one way is to use what is known as Sharpe Ratio, or reward to variability ratio. What this very simple to calculate ratio can tell us is how many units of return we receive for each unit of risk we took with our portfolio. This measure is a great way to compare investment portfolios relative to the risk taken, and I believe we can also apply it when investing in LEGO.
If you read my previous Blog Article, you know that we can calculate standard deviation for LEGO themes or set types and come up with the respective volatility. The Sharpe Ratio measure uses this same calculation to account for risk, while at the same time including the expected, or actual, return and the risk free rate. On the next examples I will assume we have already calculated standard deviations for each theme and, for simplicity, that the risk free rate is only 1%.
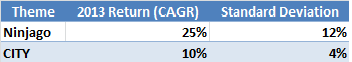
So, in 2013 Ninjago and CITY's return was 25% and 10%, respectively. The risk of each measured as standard deviation was of 12% and 4%. What follows is the formula to calculate the Sharpe Ratio (Image from Investopedia)
As you can see, the calculation of the measure itself is pretty simple, and only what comes before is what can get tricky at times. Applying the formula to the numbers presented above we get the following results:
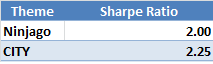
So what these numbers tell us is that, even if at first sight a Brickfolio focused on Ninjago in fact produced higher percentage returns, it is the CITY Brickfolio the one that presented the higher returns on a risk adjusted basis. Basically, the Ninjago investor was able to secure 2 units of return for each unit of risk, while the CITY investor produced 2.25 units of return for each unit of risk. Another read that you can make is that the Ninjago investor was not compensated as well as the CITY investor based on the risk taken by each.
A very basic rule of thumb when using this measure is that a higher ratio is preferable to a lower ratio. Also, as mentioned earlier, there is no need for you to wait until you have the actual returns of your Brickfolio, as you can also use your expected returns in place of the actual return as a way to compare possible future outcomes.
The Sharpe Ratio is not, of course, the end all of performance evaluation measures, but I think that it is simple and accurate enough as to be used even by the casual LEGO investor without getting into way more complicated methods. I believe that with any serious investment it is very important to evaluate as many factors as possible, and risk is certainly present even when taking about LEGO bricks. A long term investment strategy is strongly suggested, and by using Sharpe Ratio, Standard Deviation and by determining your goals early in the game (Check out Adewar's blog on viable investments and how to determine your own objectives) I think you will be a step ahead most people.
Note 1: Attached you will find an Excel spreadsheet showing the calculations used for the example in this article.
Note 2: Returns calculated by Sharpe are excess returns.
Thanks for reading!
-
 Sharpe.xlsx (9.69KB) : 10


Recommended Comments
There are no comments to display.
Join the conversation
You can post now and register later. If you have an account, sign in now to post with your account.
Note: Your post will require moderator approval before it will be visible.